The Observability Hype Train: What Actually Works When Your System Is On Fire

The Three Pillars Fallacy That Everyone Believes

Every conference talk, every vendor pitch, every blog post starts the same way. Three pillars of observability: metrics, logs, and traces. The holy trinity that will solve all your problems and give you perfect visibility into your distributed systems. I’ve watched this narrative solidify over the past five years while building and maintaining production systems that handle millions of requests daily, and I can tell you with certainty that this framework is fundamentally incomplete.

The three pillars model assumes your primary challenge is data collection. It suggests that if you just instrument everything correctly and correlate your telemetry data properly, you’ll achieve observability nirvana. This is vendor thinking, not practitioner thinking. Real observability isn’t about having more data types. It’s about having the right questions answered when your pager goes off at 3 AM and your revenue is bleeding onto the floor.

The truth is messier and more context-dependent than the tidy framework suggests. I’ve seen teams drowning in perfectly correlated traces while being completely blind to the business impact of their outages. I’ve watched organizations spend six figures on observability platforms that tell them their database is slow but can’t explain why checkout conversion dropped by 15% yesterday. The three pillars give you data, but data without operational context is just expensive noise.

Why Modern Monitoring Stacks Miss the Forest for the Trees

The current generation of observability platforms excels at showing you what happened after you already know something is wrong. They’re diagnostic tools masquerading as monitoring systems. Take distributed tracing, which vendors position as the crown jewel of modern observability. In practice, tracing shines when you’re debugging a known issue, but it’s remarkably poor at alerting you to problems you didn’t anticipate.

I spent two years implementing OpenTelemetry across a microservices architecture with 40+ services. The tracing data was beautiful. We could follow requests across service boundaries, identify bottlenecks, and debug complex interaction patterns. But here’s what we learned the hard way: trace-based alerts are either too noisy or too late. You can’t effectively alert on trace anomalies without first understanding normal patterns, and normal patterns in distributed systems are far more chaotic than the smooth percentile curves in your monitoring dashboard suggest.

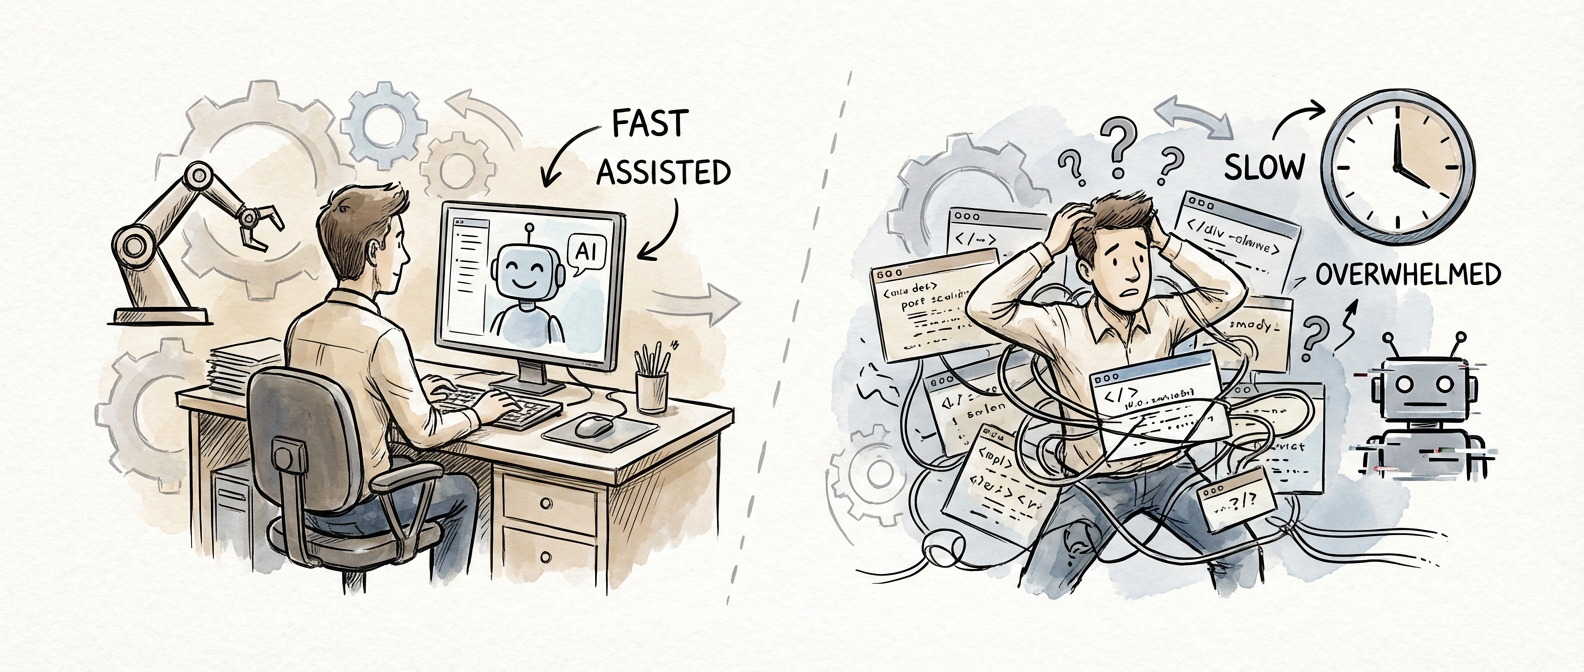
Here’s the real problem: modern observability tools optimize for richness over relevance. They assume more granular data leads to better insights, but this assumption breaks down when you’re trying to maintain situational awareness across dozens of services. The cognitive overhead of correlating metrics, logs, and traces during an incident often exceeds the benefit of having all three data types available. Your mean time to resolution doesn’t improve just because you can see every database query that contributed to a slow endpoint.

What actually works is building monitoring around business outcomes first, then instrumenting the technical components that directly impact those outcomes. This inverts the typical approach of instrumenting everything and hoping patterns emerge. Instead of starting with infrastructure metrics and trying to infer business impact, start with business metrics and work backward to the technical indicators that predict problems.

The Real Cost of Observability Theater

The observability industry has created a culture of measurement theater where teams focus on instrumentation coverage rather than operational effectiveness. I’ve audited monitoring setups where teams were collecting thousands of metrics per service but couldn’t answer basic questions about user experience or system capacity. They had impressive Grafana dashboards that looked sophisticated but provided little actionable insight during actual incidents.

This theater is expensive in ways that go beyond your monthly SaaS bill. Every custom metric, every trace span, every structured log line represents a decision point that someone on your team has to understand and maintain. The complexity compounds as your system grows. What starts as elegant instrumentation becomes a maintenance burden that slows down feature development and complicates debugging.

The storage and processing costs are just the beginning. The hidden costs include the engineering time spent tuning sampling rates, managing cardinality explosions, and debugging why your observability pipeline is consuming more resources than the application it’s monitoring. I’ve seen teams spend more engineering effort on their metrics collection than on the features their metrics are supposed to monitor.

The opportunity cost is even higher. While your team is debating the optimal trace sampling strategy, your competitors are shipping features and improving user experience. The time you spend perfecting your observability setup is time not spent making your product better. This isn’t an argument against monitoring, but it is an argument for being ruthlessly practical about what you instrument and why.

What Actually Works When Systems Fail

Effective observability starts with understanding your system’s failure modes, not its success patterns. After a decade of incident response, I can tell you that most outages follow predictable patterns specific to your architecture and business domain. Your monitoring should be designed around these known failure modes, with broad coverage for unknown issues as a secondary concern.

The monitoring that saves you during incidents is usually simple and boring. Service-level indicators based on user experience. Capacity monitoring for your bottleneck resources. Error rate tracking for your critical paths. These signals, implemented well, catch more problems faster than sophisticated tracing platforms. They also require less cognitive overhead during high-stress situations when your decision-making capacity is already compromised.

The most valuable observability improvement I’ve made in recent years was implementing proper SLI-based alerting tied directly to user impact. Instead of alerting on CPU usage or response time percentiles, we alert when user experience degrades below acceptable thresholds. This approach dramatically reduced alert noise while catching problems that traditional infrastructure monitoring missed entirely.

Context matters more than data richness. A simple dashboard that shows the relationship between deployment events, traffic patterns, and error rates provides more operational value than detailed trace analysis during most incidents. The goal isn’t perfect visibility into every system component. The goal is rapid problem identification and reliable impact assessment.

Building Observability That Survives Production

Sustainable observability requires treating your monitoring infrastructure as a product, not a collection of tools. This means having clear ownership, defined user stories, and regular evaluation of whether your observability investment is delivering operational value. Most teams bolt monitoring onto their architecture as an afterthought and wonder why it doesn’t provide the insights they need.

The observability that survives production stress is designed for your specific operational needs, not general-purpose visibility. Start with your incident response process and work backward to the data requirements. What questions do you need answered in the first five minutes of an outage? What context helps you make decisions under pressure? Design your instrumentation to answer these specific questions rather than trying to capture everything that might be useful.

Testing your monitoring is as important as testing your application code. Run failure scenarios and evaluate whether your observability stack provides the information you need to respond effectively. Many teams discover during actual outages that their carefully crafted monitoring doesn’t work when the systems it’s monitoring are degraded. Your observability infrastructure should be more reliable than the systems it monitors, not less.

The best observability implementations I’ve seen are boring and pragmatic. They solve real operational problems without creating new ones. They focus on high-signal indicators rather than comprehensive coverage. They’re designed by people who’ve been on call and understand that perfect visibility is less important than fast recovery. If you’re building observability systems or evaluating existing ones, I’d love to hear about your experiences with what actually works in production environments.

The Observability Hype Train: What Actually Works When Your System Is On Fire

The Three Pillars Fallacy That Everyone Believes

Every conference talk, every vendor pitch, every blog post starts the same way. Three pillars of observability: metrics, logs, and traces. The holy trinity that will solve all your problems and give you perfect visibility into your distributed systems. I’ve watched this narrative solidify over the past five years while building and maintaining production systems that handle millions of requests daily, and I can tell you with certainty that this framework is fundamentally incomplete.

The three pillars model assumes your main challenge is data collection. It suggests that if you just instrument everything correctly and correlate your telemetry data properly, you’ll achieve observability nirvana. This is vendor thinking, not practitioner thinking. Real observability isn’t about having more data types. It’s about having the right questions answered when your pager goes off at 3 AM and your revenue is bleeding onto the floor.

The truth is messier and more context-dependent than the tidy framework suggests. I’ve seen teams drowning in perfectly correlated traces while being completely blind to the business impact of their outages. I’ve watched organizations spend six figures on observability platforms that tell them their database is slow but can’t explain why checkout conversion dropped by 15% yesterday. The three pillars give you data, but data without operational context is just expensive noise.

Why Modern Monitoring Stacks Miss the Forest for the Trees

The current generation of observability platforms excels at showing you what happened after you already know something is wrong. They’re diagnostic tools masquerading as monitoring systems. Take distributed tracing, which vendors position as the crown jewel of modern observability. In practice, tracing shines when you’re debugging a known issue, but it’s remarkably poor at alerting you to problems you didn’t anticipate.

I spent two years implementing OpenTelemetry across a microservices architecture with 40+ services. The tracing data was beautiful. We could follow requests across service boundaries, identify bottlenecks, and debug complex interaction patterns. But here’s what we learned the hard way: trace-based alerts are either too noisy or too late. You can’t effectively alert on trace anomalies without first understanding normal patterns, and normal patterns in distributed systems are far more chaotic than the smooth percentile curves in your monitoring dashboard suggest.

The problem is that modern observability tools optimize for richness over relevance. They assume more granular data leads to better insights, but this assumption breaks down when you’re trying to maintain situational awareness across dozens of services. The cognitive overhead of correlating metrics, logs, and traces during an incident often exceeds the benefit of having all three data types available. Your mean time to resolution doesn’t improve just because you can see every database query that contributed to a slow endpoint.

What actually works is building monitoring around business outcomes first, then instrumenting the technical components that directly impact those outcomes. This flips the typical approach of instrumenting everything and hoping patterns emerge. Instead of starting with infrastructure metrics and trying to infer business impact, start with business metrics and work backward to the technical indicators that predict problems.

The Real Cost of Observability Theater

The observability industry has created a culture of measurement theater where teams focus on instrumentation coverage rather than operational effectiveness. I’ve audited monitoring setups where teams were collecting thousands of metrics per service but couldn’t answer basic questions about user experience or system capacity. They had impressive Grafana dashboards that looked sophisticated but provided little actionable insight during actual incidents.

This theater is expensive in ways that go beyond your monthly SaaS bill. Every custom metric, every trace span, every structured log line is a decision point that someone on your team has to understand and maintain. The complexity compounds as your system grows. What starts as elegant instrumentation becomes a maintenance burden that slows down feature development and complicates debugging.

The storage and processing costs are just the beginning. The hidden costs include the engineering time spent tuning sampling rates, managing cardinality explosions, and debugging why your observability pipeline is consuming more resources than the application it’s monitoring. I’ve seen teams spend more engineering effort on their metrics collection than on the features their metrics are supposed to monitor.

The opportunity cost is even higher. While your team is debating the optimal trace sampling strategy, your competitors are shipping features and improving user experience. The time you spend perfecting your observability setup is time not spent making your product better. This isn’t an argument against monitoring, but it is an argument for being ruthlessly practical about what you instrument and why.

What Actually Works When Systems Fail

Effective observability starts with understanding your system’s failure modes, not its success patterns. After a decade of incident response, I can tell you that most outages follow predictable patterns specific to your architecture and business domain. Your monitoring should be designed around these known failure modes, with broad coverage for unknown issues as a secondary concern.

The monitoring that saves you during incidents is usually simple and boring. Service-level indicators based on user experience. Capacity monitoring for your bottleneck resources. Error rate tracking for your critical paths. These signals, implemented well, catch more problems faster than sophisticated tracing platforms. They also require less cognitive overhead during high-stress situations when your decision-making capacity is already compromised.

The most valuable observability improvement I’ve made in recent years was implementing proper SLI-based alerting tied directly to user impact. Instead of alerting on CPU usage or response time percentiles, we alert when user experience degrades below acceptable thresholds. This approach dramatically reduced alert noise while catching problems that traditional infrastructure monitoring missed entirely.

Context matters more than data richness. A simple dashboard that shows the relationship between deployment events, traffic patterns, and error rates provides more operational value than detailed trace analysis during most incidents. The goal isn’t perfect visibility into every system component. The goal is rapid problem identification and reliable impact assessment.

Building Observability That Survives Production

Sustainable observability requires treating your monitoring infrastructure as a product, not a collection of tools. This means having clear ownership, defined user stories, and regular evaluation of whether your observability investment is delivering operational value. Most teams bolt monitoring onto their architecture as an afterthought and wonder why it doesn’t provide the insights they need.

The observability that survives production stress is designed for your specific operational needs, not general-purpose visibility. Start with your incident response process and work backward to the data requirements. What questions do you need answered in the first five minutes of an outage? What context helps you make decisions under pressure? Design your instrumentation to answer these specific questions rather than trying to capture everything that might be useful.

Testing your monitoring is as important as testing your application code. Run failure scenarios and evaluate whether your observability stack provides the information you need to respond effectively. Many teams discover during actual outages that their carefully crafted monitoring doesn’t work when the systems it’s monitoring are degraded. Your observability infrastructure should be more reliable than the systems it monitors, not less.

The best observability implementations I’ve seen are boring and pragmatic. They solve real operational problems without creating new ones. They focus on high-signal indicators rather than comprehensive coverage. They’re designed by people who’ve been on call and understand that perfect visibility is less important than fast recovery. If you’re building observability systems or evaluating existing ones, I’d love to hear about your experiences with what actually works in production environments.

Choosing Communication Protocols for Microservices: What 15 Years of Distributed Systems Taught Me

The Protocol Decision That Haunts Every Architecture Review

I’ve watched countless teams agonize over microservices communication protocols, and I’ve made my share of wrong choices that came back to bite us months later. After building distributed systems across fintech, e-commerce, and healthcare, I’ve learned that the protocol decision isn’t just technical. It shapes your operational burden, debugging experience, and your team’s velocity for years to come.

The truth is, there’s no universally correct answer. I’ve seen REST APIs scale beautifully to hundreds of millions of requests per day, and I’ve seen them become bottlenecks that required complete rewrites. I’ve implemented message queues that saved our architecture during Black Friday traffic spikes, and others that became debugging nightmares when messages started disappearing into the void. The key is understanding the tradeoffs and matching them to your specific constraints.

Let me walk you through the four communication patterns I’ve relied on most, why each succeeds or fails, and how to make informed decisions that your future self will thank you for. These aren’t theoretical comparisons. They’re battle-tested insights from systems that processed real money, served real users, and kept teams awake at night when they broke.

Synchronous HTTP: The Reliable Workhorse You Underestimate

REST over HTTP gets dismissed as boring, but I’ve built systems handling 50,000 requests per second on well-architected HTTP APIs. The secret isn’t the protocol. It’s the discipline around timeouts, circuit breakers, and retry policies. When you’re starting a microservices journey, HTTP synchronous communication gives you the most predictable failure modes and the richest ecosystem of tools.

The debugging story alone makes HTTP worth considering. When a request fails, you have a complete trace from client to server with standard HTTP status codes, headers, and request/response bodies. Your existing monitoring tools understand HTTP. Your load balancers, API gateways, and observability platforms all speak HTTP fluently. This operational familiarity translates directly into faster incident response and lower mean time to recovery.

Where HTTP breaks down is in high-throughput scenarios with tight latency requirements. I learned this the hard way building a real-time trading system where every additional millisecond of network overhead translated to measurable revenue loss. HTTP’s request-response cycle becomes a constraint when you need sub-millisecond communication or when you’re pushing tens of thousands of requests per second between services.

The career lesson here is that boring technology choices often win. Unless you have specific performance requirements that HTTP can’t meet, the operational simplicity usually outweighs the theoretical benefits of more exotic protocols. I’ve seen too many teams adopt complex communication patterns prematurely and spend months debugging problems that wouldn’t exist with straightforward HTTP APIs.

Message Queues: Async Resilience with a Learning Curve

Message queues fundamentally change how you think about service communication. Instead of services talking directly to each other, they communicate through an intermediary that provides durability, ordering guarantees, and natural decoupling. I’ve used this pattern to build systems that gracefully handle traffic spikes, service outages, and deployment rolling restarts without dropping a single transaction.

The resilience benefits are real, but they come with complexity costs that many teams underestimate. Message ordering becomes a design concern. You need to think carefully about partition keys and consumer group configurations. Error handling requires dead letter queues, retry logic, and monitoring for message lag. Your deployment process becomes more complex because you’re now managing queue infrastructure alongside your application code.

I learned the hard way that message queues excel when you can tolerate eventual consistency and when you have natural event boundaries in your domain. For an e-commerce platform, order processing works beautifully with queues because each step (payment, inventory, shipping) can happen asynchronously. For user authentication, where you need immediate feedback, queues add unnecessary complexity.

From a career perspective, understanding message queue patterns makes you valuable on teams building large-scale systems. The async mindset that queues enforce (designing for eventual consistency, handling partial failures gracefully, monitoring queue depth and consumer lag) transfers to many distributed systems challenges beyond just service communication.

gRPC: Performance with Protocol Buffer Precision

gRPC emerged from Google’s internal needs for efficient service-to-service communication, and it shows. The combination of HTTP/2 transport, Protocol Buffer serialization, and built-in code generation creates a communication layer that’s both faster and more type-safe than traditional REST APIs. I’ve measured 40-60% reduction in serialization overhead and 20-30% improvement in network utilization compared to JSON over HTTP.

The developer experience advantages go beyond raw performance. Protocol Buffer schemas enforce contracts between services at compile time, catching integration issues before they hit production. The code generation creates client libraries that feel like calling local methods, reducing the cognitive overhead of network communication. Built-in features like deadlines, cancellation, and load balancing give you production-ready capabilities without additional framework dependencies.

Where gRPC struggles is in mixed environments and debugging workflows. Browser support requires a proxy layer. HTTP-based tooling (curl, Postman, browser developer tools) doesn’t work directly with gRPC endpoints. When you’re troubleshooting production issues, the binary protocol format makes ad-hoc debugging more complex than inspecting JSON payloads.

I recommend gRPC when you’re building service-to-service communication within a controlled environment where you can standardize on the toolchain. If you’re exposing APIs to external consumers, mobile apps, or web frontends, the additional complexity rarely justifies the performance gains. The sweet spot is backend services where type safety and performance matter more than universal accessibility.

Event Streaming: Building Systems That React and Remember

Event streaming platforms like Apache Kafka represent a different philosophy entirely. Instead of services requesting data or sending commands, they publish events that represent facts about what happened in your system. Other services consume these event streams and build their own local state. I’ve used this pattern to build systems where individual services can be completely rebuilt from the event log, creating a level of operational resilience that traditional communication patterns can’t match.

The architectural implications run deep. Event streaming encourages designing services around domain events rather than CRUD operations. Your data flows become visible and auditable. You can replay events to debug production issues or build new services that consume historical data. The decoupling is more thorough than message queues because consumers don’t need to know about producers, and new consumers can be added without changing existing services.

The complexity cost is substantial. Event schema evolution requires careful planning and backward compatibility strategies. Operating Kafka clusters demands specialized knowledge about topics, partitions, replication, and consumer group management. The eventual consistency model requires rethinking how you handle user interactions and business workflows.

Event streaming shines when you’re building systems where audit trails, replay capabilities, and loosely coupled services justify the operational overhead. Financial services, IoT platforms, and large-scale analytics systems often benefit from this pattern. For smaller applications or teams just starting with microservices, the complexity usually isn’t worth the benefits.

Making Decisions Your Future Self Will Thank You For

After fifteen years of building distributed systems, my advice is to start simple and evolve based on real constraints, not theoretical ones. Begin with HTTP APIs for most service communication, introduce message queues where you need resilience or async processing, and consider gRPC or event streaming only when you have specific requirements that justify the additional complexity.

The most successful microservices architectures I’ve worked on used different communication patterns for different use cases within the same system. User-facing APIs stayed on HTTP for tooling compatibility. High-volume service-to-service communication moved to gRPC for performance. Background processing used message queues for resilience. Critical business events flowed through event streams for audit and replay capabilities.

Your choice of communication protocol shapes more than your system’s performance characteristics. It shapes your team’s daily operational experience. Choose protocols that your team can debug, monitor, and evolve confidently. The fanciest architecture in the world won’t help you if you can’t figure out why requests are timing out at 3 AM.

What communication challenges are you facing in your current architecture? I’d love to hear about specific scenarios where you’re weighing these tradeoffs. The real-world constraints often reveal insights that generic advice misses.

Choosing Communication Protocols for Microservices: What 15 Years of Distributed Systems Taught Me

The Protocol Decision That Haunts Every Architecture Review

I’ve watched countless teams agonize over microservices communication protocols, and I’ve made my share of wrong choices that came back to bite us months later. After building distributed systems across fintech, e-commerce, and healthcare, I’ve learned that the protocol decision isn’t just technical. It shapes your operational burden, debugging experience, and your team’s velocity for years.

The truth is, there’s no universally correct answer. I’ve seen REST APIs scale beautifully to hundreds of millions of requests per day, and I’ve seen them become bottlenecks that required complete rewrites. I’ve implemented message queues that saved our architecture during Black Friday traffic spikes, and others that became debugging nightmares when messages started disappearing into the void. The key is understanding the tradeoffs and matching them to your specific constraints.

Let me walk you through the four communication patterns I’ve relied on most, why each succeeds or fails, and how to make informed decisions that your future self will thank you for. These aren’t theoretical comparisons. They’re battle-tested insights from systems that processed real money, served real users, and kept teams awake at night when they broke.

Synchronous HTTP: The Reliable Workhorse You Underestimate

REST over HTTP gets dismissed as boring, but I’ve built systems handling 50,000 requests per second on well-architected HTTP APIs. The secret isn’t the protocol. It’s the discipline around timeouts, circuit breakers, and retry policies. When you’re starting a microservices journey, HTTP synchronous communication gives you the most predictable failure modes and the richest ecosystem of tools.

The debugging story alone makes HTTP worth considering. When a request fails, you have a complete trace from client to server with standard HTTP status codes, headers, and request/response bodies. Your existing monitoring tools understand HTTP. Your load balancers, API gateways, and observability platforms all speak HTTP fluently. This operational familiarity translates directly into faster incident response and lower mean time to recovery.

Where HTTP breaks down is in high-throughput scenarios with tight latency requirements. I learned this the hard way building a real-time trading system where every additional millisecond of network overhead translated to measurable revenue loss. HTTP’s request-response cycle becomes a constraint when you need sub-millisecond communication or when you’re pushing tens of thousands of requests per second between services.

The career lesson here? Boring technology choices often win. Unless you have specific performance requirements that HTTP can’t meet, the operational simplicity usually outweighs the theoretical benefits of more exotic protocols. I’ve seen too many teams adopt complex communication patterns prematurely and spend months debugging problems that wouldn’t exist with straightforward HTTP APIs.

Message Queues: Async Resilience with a Learning Curve

Message queues fundamentally change how you think about service communication. Instead of services talking directly to each other, they communicate through an intermediary that provides durability, ordering guarantees, and natural decoupling. I’ve used this pattern to build systems that gracefully handle traffic spikes, service outages, and deployment rolling restarts without dropping a single transaction.

The resilience benefits are real, but they come with complexity costs that many teams underestimate. Message ordering becomes a design concern. You need to think carefully about partition keys and consumer group configurations. Error handling requires dead letter queues, retry logic, and monitoring for message lag. Your deployment process becomes more complex because you’re now managing queue infrastructure alongside your application code.

I learned the hard way that message queues excel when you can tolerate eventual consistency and when you have natural event boundaries in your domain. For an e-commerce platform, order processing works beautifully with queues because each step (payment, inventory, shipping) can happen asynchronously. For user authentication, where you need immediate feedback, queues add unnecessary complexity.

From a career perspective, understanding message queue patterns makes you valuable on teams building large-scale systems. The async mindset that queues enforce (designing for eventual consistency, handling partial failures gracefully, monitoring queue depth and consumer lag) transfers to many distributed systems challenges beyond just service communication.

gRPC: Performance with Protocol Buffer Precision

gRPC emerged from Google’s internal needs for efficient service-to-service communication, and it shows. The combination of HTTP/2 transport, Protocol Buffer serialization, and built-in code generation creates a communication layer that’s both faster and more type-safe than traditional REST APIs. I’ve measured 40-60% reduction in serialization overhead and 20-30% improvement in network utilization compared to JSON over HTTP.

The developer experience advantages go beyond raw performance. Protocol Buffer schemas enforce contracts between services at compile time, catching integration issues before they hit production. The code generation creates client libraries that feel like calling local methods, reducing the cognitive overhead of network communication. Built-in features like deadlines, cancellation, and load balancing give you production-ready capabilities without extra framework dependencies.

Where gRPC struggles is in mixed environments and debugging workflows. Browser support requires a proxy layer. HTTP-based tooling (curl, Postman, browser developer tools) doesn’t work directly with gRPC endpoints. When you’re troubleshooting production issues, the binary protocol format makes ad-hoc debugging more complex than inspecting JSON payloads.

I recommend gRPC when you’re building service-to-service communication within a controlled environment where you can standardize on the toolchain. If you’re exposing APIs to external consumers, mobile apps, or web frontends, the extra complexity rarely justifies the performance gains. The sweet spot is backend services where type safety and performance matter more than universal accessibility.

Event Streaming: Building Systems That React and Remember

Event streaming platforms like Apache Kafka represent a different philosophy entirely. Instead of services requesting data or sending commands, they publish events that represent facts about what happened in your system. Other services consume these event streams and build their own local state. I’ve used this pattern to build systems where individual services can be completely rebuilt from the event log, creating a level of operational resilience that traditional communication patterns can’t match.

The architectural implications run deep. Event streaming encourages designing services around domain events rather than CRUD operations. Your data flows become visible and auditable. You can replay events to debug production issues or build new services that consume historical data. The decoupling is more thorough than message queues because consumers don’t need to know about producers, and new consumers can be added without changing existing services.

The complexity cost is substantial. Event schema evolution requires careful planning and backward compatibility strategies. Operating Kafka clusters demands specialized knowledge about topics, partitions, replication, and consumer group management. The eventual consistency model requires rethinking how you handle user interactions and business workflows.

Event streaming shines when you’re building systems where audit trails, replay capabilities, and loosely coupled services justify the operational overhead. Financial services, IoT platforms, and large-scale analytics systems often benefit from this pattern. For smaller applications or teams just starting with microservices, the complexity usually isn’t worth the benefits.

Making Decisions Your Future Self Will Thank You For

After fifteen years of building distributed systems, my advice is to start simple and evolve based on real constraints, not theoretical ones. Begin with HTTP APIs for most service communication, introduce message queues where you need resilience or async processing, and consider gRPC or event streaming only when you have specific requirements that justify the extra complexity.

The most successful microservices architectures I’ve worked on used different communication patterns for different use cases within the same system. User-facing APIs stayed on HTTP for tooling compatibility. High-volume service-to-service communication moved to gRPC for performance. Background processing used message queues for resilience. Critical business events flowed through event streams for audit and replay capabilities.

Your choice of communication protocol shapes your system’s performance characteristics and your team’s daily operational experience. Choose protocols that your team can debug, monitor, and evolve confidently. The fanciest architecture in the world won’t help you if you can’t figure out why requests are timing out at 3 AM.

What communication challenges are you facing in your current architecture? I’d love to hear about specific scenarios where you’re weighing these tradeoffs. The real-world constraints often reveal insights that generic advice misses.

Database Performance: Your First Steps Beyond Getting It to Work

Database Performance: Your First Steps Beyond Getting It to Work

Why Most Applications Hit Their First Wall

I’ve watched hundreds of developers reach the same inflection point. The application works beautifully on their laptop with ten rows of test data. The demo goes smoothly. Then production happens, and suddenly every page takes eight seconds to load. The database server’s CPU pegs at 100%, and panic sets in.

Database Performance: Your First Steps Beyond Getting It to Work

This moment is predictable because most of us learn databases backwards. We start with complex queries and schema design, but we skip the fundamentals of how databases actually retrieve and manipulate data. When I mentor junior developers, I always start with the same foundation: understanding what happens when your application asks the database for information.

Here’s the thing though. Database performance follows patterns. Once you understand these patterns, you can predict where problems will emerge and address them before they become emergencies. You can build applications that scale gracefully from day one instead of scrambling to fix performance disasters later.

Illustration for Database Performance: Your First Steps Beyond Getting It to Work

The Three Levers That Control Everything

Database performance comes down to three basic operations: seeking data, reading data, and transforming data. Every query you write manipulates these three levers in different proportions. Master these, and you master database performance.

Seeking is about finding the right rows. When your database scans a million-row table to find ten matching records, you’re watching a seek-heavy operation in action. This is where indexes become your best friend. Think of an index like a phone book. It’s a sorted lookup table that lets your database jump directly to the data you need instead of checking every single row one by one.

Reading is about moving data from storage into memory. Even with perfect indexes, reading a gigabyte of data takes time. This is where query selectivity matters big time. The difference between `SELECT *` and `SELECT name, email` might seem like no big deal with ten rows. But it becomes huge when you’re working with wide tables and large result sets.

Transforming means sorting, grouping, joining, and computing. Your database is essentially a specialized computer, and complex transformations require CPU cycles and memory. When you ask for results sorted by three columns, grouped by region, with running totals, you’re asking the database to do some serious computational work.

Building Your Performance Toolkit

Every database system has tools that show you exactly what it’s doing behind the scenes. Learning to use these tools is like learning to read an X-ray. Once you can see what’s happening inside your queries, optimization stops being guesswork and becomes methodical.

Start with EXPLAIN or EXPLAIN ANALYZE (the exact syntax varies by database). This command shows you the database’s execution plan for any query. The output looks like gibberish at first, but focus on three key things: whether indexes are being used, how many rows are being examined versus returned, and where the time is actually spent.

For example, if you see “Seq Scan on users” in PostgreSQL, your database is checking every row in the users table. If you see “Index Scan using idx_users_email,” it’s using an index to jump directly to relevant rows. The difference between these two approaches can mean milliseconds versus seconds of execution time.

You’ll also want to monitor actual query performance over time. Most databases have query logs that show slow queries, execution times, and frequency. Set up logging for queries that take longer than 100 milliseconds. This threshold catches real problems without drowning you in noise from fast queries.

Your First Three Optimizations

When you’re ready to optimize, start with the changes that give you the biggest bang for your buck and the lowest risk of breaking things. I always recommend this sequence because it builds momentum and teaches you to think systematically about performance.

Begin with missing indexes. Run your application under realistic load and identify the slowest queries. For each slow query, check whether it’s scanning large tables without indexes. Adding an index on frequently queried columns often gives you 10x to 100x performance improvements. Start with foreign keys and columns used in WHERE clauses. These are usually safe bets.

Next, look at your SELECT statements. Many applications retrieve way more data than they actually use. If your user list page displays name and email, but your query selects all 20 columns from the users table, you’re moving unnecessary data across the network and consuming extra memory. This optimization often cuts query time by 30-50% and gets better as your tables grow.

Finally, hunt down N+1 query patterns. This happens when your application makes one query to fetch a list, then makes additional queries for each item in that list. Loading a page with 20 users might trigger 21 database queries: one for the user list, then one per user to fetch their profile picture or latest activity. You can solve this with joins or batch queries and eliminate dozens of database round trips.

Growing Into Advanced Territory

Once you’ve got the basics down, database optimization becomes about understanding trade-offs and thinking about the whole system. Every optimization decision involves balancing competing concerns: read performance versus write performance, storage space versus query speed, simplicity versus maintainability.

Take query caching, for instance. Caching frequent queries can dramatically reduce database load, but it introduces complexity around cache invalidation. When do you clear the cache? How do you handle cache misses? These questions don’t have universal answers. They depend on your specific application patterns and requirements.

Database schema design decisions made early in your application’s life become increasingly painful to change as data volume grows. Adding an index to a ten-million-row table might take hours and lock the table during creation. Changing column types or splitting tables requires careful migration planning and potentially downtime.

The key is building performance awareness into your development process from the beginning. Write queries with indexing in mind. Design schemas that support your access patterns. Monitor performance continuously rather than waiting for problems to slap you in the face.

Database performance optimization is part science, part educated guessing. The science lies in understanding how your database system works and measuring actual performance with real tools. The guessing part comes from predicting future scaling challenges and making design decisions that accommodate growth. If you’re just starting this journey, focus on building solid measurement and analysis habits. The optimization techniques will come naturally once you can see what’s actually happening under the hood.

The Coming Evolution of CI/CD: From Pipeline Plumbing to Platform Intelligence

The Coming Evolution of CI/CD: From Pipeline Plumbing to Platform Intelligence

The Current State: What We Actually Know Works

After fifteen years of watching CI/CD evolve from Jenkins cron jobs to sophisticated orchestration platforms, I can tell you this much with certainty: the fundamentals haven’t changed as much as the tooling suggests. The core principles that separate reliable pipelines from brittle ones remain consistent across every organization I’ve worked with, from scrappy startups to Fortune 500 enterprises.

The Coming Evolution of CI/CD: From Pipeline Plumbing to Platform Intelligence

Fast feedback loops still matter more than fancy dashboards. Deterministic builds still trump clever optimizations that introduce flakiness. Separating build, test, and deploy stages still prevents the kind of catastrophic coupling that brings down entire delivery cycles. These aren’t philosophical positions anymore. They’re engineering requirements proven by thousands of production deployments.

The patterns I see working consistently across teams come down to three non-negotiable design principles. First, immutable artifacts that can be traced from commit to production without modification. Second, environment parity that eliminates the “works on my machine” problem at the platform level. Third, progressive deployment strategies that contain blast radius when things inevitably go wrong.

The Emerging Patterns: Signals in the Noise

What’s genuinely interesting right now isn’t the latest feature in GitLab or Azure DevOps. It’s the convergence happening around pipeline-as-code patterns that treat delivery infrastructure with the same rigor we apply to application code. The organizations getting this right version-control their entire pipeline definitions, applying the same code review processes to deployment logic that they do to business logic.

I’m seeing a clear trend toward declarative pipeline specifications that abstract away platform-specific implementation details. Teams are moving beyond vendor-specific YAML configurations toward more portable definitions that can adapt to different execution environments. This isn’t just about avoiding vendor lock-in. It’s about building delivery systems that can evolve independent of the underlying compute platform.

The most sophisticated teams are also embracing policy-as-code for their compliance and security gates. Instead of manual approval processes that create bottlenecks, they’re encoding organizational requirements directly into the pipeline logic. This shift from procedural to declarative compliance checking represents a fundamental change in how we think about governance in automated systems.

The Intelligence Layer: Where Platform Meets Prediction

Here’s where things get speculative, but the early indicators are compelling. The next evolution in CI/CD will likely center around platforms that learn from delivery patterns and optimize themselves accordingly. I’ve been testing some early implementations that use historical build data to predict optimal resource allocation and identify potential failure points before they happen.

The key insight is that successful pipelines generate enormous amounts of structured data about build performance, test reliability, and deployment outcomes. Teams that capture and analyze this data systematically are already seeing measurable improvements in delivery velocity and reliability. The logical next step is platforms that perform this analysis automatically and adjust pipeline behavior in real-time.

What excites me most about this direction is the potential for predictive pipeline optimization. Imagine delivery systems that can automatically adjust test suite execution based on code change patterns, or that pre-provision deployment infrastructure based on release timing predictions. The foundational work for this capability is already happening in the observability and AIOps spaces.

The Integration Horizon: Beyond the Pipeline Boundary

The most significant long-term trend I’m tracking is the dissolution of boundaries between CI/CD platforms and broader development infrastructure. The distinction between “build system” and “development environment” is already blurring in organizations that have adopted cloud-native development workflows.

Progressive development teams are building integrated platforms where code completion, testing, deployment, and monitoring operate as a unified system rather than loosely connected tools. This isn’t just about better developer experience, though that’s important. It’s about creating feedback loops that span the entire development lifecycle, from initial code authoring through production operation.

My speculation here involves platforms that can optimize across these traditionally separate domains. Think about CI/CD systems that can influence IDE behavior based on deployment patterns, or that automatically adjust monitoring configurations based on code changes detected during the build process. The technical foundation for this kind of deep integration exists today. The organizational and vendor ecosystem changes required to make it practical are the real challenge.

Practical Implications: Building for Tomorrow’s Reality

For teams designing CI/CD systems today, the strategic question isn’t which specific tools to adopt. It’s how to structure delivery infrastructure that can evolve toward these emerging patterns without requiring complete reconstruction. The organizations that will benefit most from platform intelligence are those building on solid foundations today.

This means investing in comprehensive telemetry collection from your current pipelines, even if you’re not ready to act on that data yet. It means treating pipeline definitions as first-class code artifacts with proper testing and versioning disciplines. Most importantly, it means designing delivery workflows that can accommodate increasing automation without losing human oversight where it matters.

The teams getting this right are also thinking beyond their current organizational boundaries. They’re building delivery systems that can adapt to changing compliance requirements, scale across different business units, and integrate with external vendor platforms without creating tight coupling dependencies.

I’m curious about your experiences with these evolving patterns, particularly if you’ve experimented with any of the predictive optimization approaches I’ve described. The gap between what’s technically possible and what’s organizationally practical in this space creates fascinating implementation challenges that vary dramatically across different contexts.

Event Sourcing and CQRS: When Complexity Actually Pays Off

The Problem That Led Me Here

Three years into building what started as a straightforward e-commerce platform, we hit a wall that changed everything. Our MySQL database was choking on complex queries that joined eight tables just to render a product page. The business needed real-time inventory updates, detailed audit trails for compliance, and the ability to reconstruct any order state from six months ago. Traditional CRUD operations created race conditions during flash sales, and our attempts to bolt on event logging felt like architectural debt we’d never pay down.

That’s when I first encountered Event Sourcing and Command Query Responsibility Segregation (CQRS) as more than academic concepts. Not as silver bullets, but as patterns that directly addressed our pain points. The learning curve was brutal, and implementation took eight months of careful refactoring. But the result was a system that handled Black Friday traffic while maintaining complete data lineage and supporting complex business intelligence queries without breaking a sweat.

Event Sourcing: Your Database as an Immutable Log

Event Sourcing flips the traditional database model on its head. Instead of storing the current state of your entities, you store every state change as an immutable event in an append-only log. Think of it as your database keeping a perfect diary of everything that ever happened, rather than just remembering where things stand right now. When you need the current state of an entity, you replay all its events from the beginning of time.

The mental shift is huge. In our e-commerce system, we stopped storing “Order.status = ‘shipped'” and started storing events like “OrderCreated”, “PaymentProcessed”, “ItemsPicked”, and “OrderShipped”. Each event contains the delta information needed to move from one state to the next, along with metadata about when it happened and who triggered it. The order’s current status becomes a derived value, calculated by folding over its event stream.

This approach solves several problems at once. Audit trails become trivial because they’re built into the architecture. You can replay events to debug issues that happened months ago. Time travel queries let you answer questions like “what was our inventory level on March 15th?” And because events are immutable, you eliminate entire classes of concurrency bugs that plague traditional update-in-place systems.

The implementation details matter enormously. We chose PostgreSQL with a JSONB column for event payload storage, leveraging its excellent concurrent append performance. Event versioning became critical early on when our “OrderCreated” event schema evolved to include shipping preferences. We learned to store both the event version and a transformation mapping so older events could be replayed correctly. The event store itself needs careful attention to partitioning strategies and retention policies, especially when you’re dealing with high-volume streams.

CQRS: Separating Reads from Writes

Command Query Responsibility Segregation pairs naturally with Event Sourcing, though each pattern can exist independently. CQRS recognizes that the optimal data structure for handling commands (writes) rarely matches what you need for queries (reads). Instead of forcing both through the same model, you split them completely.

On the command side, you have aggregates that enforce business rules and emit events. These aggregates are loaded from the event stream, execute business logic, and produce new events if the operation succeeds. The command model cares deeply about consistency and invariants but doesn’t need to optimize for query performance. Our Order aggregate, for example, validates that you can’t ship an order that hasn’t been paid for, but it doesn’t need to efficiently answer questions about revenue trends by geographic region.

The query side builds specialized read models from the event stream. These projections are optimized for specific query patterns and can use completely different storage technologies. We run MongoDB collections for product catalog searches, Redis sorted sets for real-time leaderboards, and Elasticsearch indices for customer support queries. Each read model subscribes to relevant events and maintains its own denormalized view of the data.

The decoupling is liberating but comes with operational complexity. You now have eventual consistency between command and query sides. You need robust event processing infrastructure to keep projections up to date. Failed projection updates require replay mechanisms. And you’ll spend time explaining to stakeholders why they can’t immediately query data they just wrote. But for systems with complex read requirements and high write volumes, the trade-offs make sense.

Implementation Lessons from the Trenches

The devil lives in the details, and Event Sourcing with CQRS has plenty of them. Event versioning will bite you if you don’t plan for it from day one. We learned this when adding a new field to our “ProductPriceChanged” event broke our projection rebuilds. Now we version every event schema and maintain upcasting functions to transform old events into current formats during replay.

Snapshotting becomes essential as event streams grow. Rebuilding an aggregate from 10,000 events is computationally expensive and slow. We implemented snapshot storage every 100 events, with careful attention to snapshot versioning. The snapshot format needs to evolve with your aggregate structure, and you need mechanisms to rebuild snapshots when the aggregate logic changes.

Event ordering and idempotency require careful thought. We use UUIDs for event IDs and sequence numbers per aggregate stream. Global ordering across all events is expensive, so we rely on vector clocks for cross-aggregate causality when needed. Idempotent event processing protects against duplicate events during retries, using event IDs as deduplication keys in our projections.

Performance characteristics are completely different from traditional systems. Writes are fast because you’re just appending events, but reads require projection maintenance. Cold start times can be painful when rebuilding large projections from scratch. We’ve learned to balance projection complexity against rebuild time, sometimes maintaining multiple projections for different query patterns rather than building one complex view.

When the Complexity is Worth It

Event Sourcing and CQRS aren’t appropriate for every system. The complexity overhead is substantial, and the learning curve for your team will slow initial development. But for domains with complex business rules, audit requirements, or evolving query patterns, these patterns provide architectural foundations that traditional approaches struggle to match.

Financial systems, where audit trails are mandatory and business rules are complex, are natural fits. E-commerce platforms with sophisticated inventory management and customer behavior analytics benefit enormously. Any system where you need to support business intelligence workloads alongside operational transactions will appreciate the read-write separation.

The patterns also shine in event-driven architectures where you’re already thinking in terms of domain events. If your system publishes events for external consumption anyway, storing them as your primary persistence mechanism feels natural rather than forced.

After three years of running Event Sourcing and CQRS in production, I’m convinced that these patterns earn their complexity for the right problems. The operational overhead is real, but so are the capabilities they enable. When someone asks me about reconstructing system state from two years ago or adding a new real-time dashboard without impacting write performance, I sleep well knowing our architecture can handle it. If you’re dealing with similar challenges and want to dig deeper into implementation details, I’d be happy to share more of what we learned along the way.

A Gentle Introduction to Microservices Communication: Starting with What Actually Works

Why Communication Patterns Matter More Than You Think

After spending the better part of a decade untangling distributed systems that someone thought were “simple,” I’ve learned that microservices communication is where most projects either flourish or die a slow, debugging-heavy death. The choice of how your services talk to each other isn’t just a technical decision. It’s an architectural foundation that will either support your team’s growth or become the source of 3 AM wake-up calls for years to come.

When you’re starting with microservices, the sheer number of communication options can feel overwhelming. HTTP/REST, message queues, event streaming, gRPC, GraphQL federation. Each comes with its own set of trade-offs, and frankly, most tutorials skip the part where they tell you what happens when things go wrong. Let me walk you through what I wish someone had told me when I was staring at my first service-to-service communication challenge.

There’s no perfect protocol. There are only protocols that match your current constraints and team capabilities. Start simple, learn the fundamentals, then evolve. I’ve seen too many teams jump straight to complex event-driven architectures because they read it was “best practice,” only to spend months debugging message ordering issues they didn’t know existed.

HTTP/REST: Your Reliable Starting Point

Despite what the latest conference talks might suggest, HTTP/REST remains the most practical starting point for microservices communication. It’s synchronous, it’s debuggable, and every developer on your team already understands it. When I’m architecting a new system, I start here unless I have a compelling reason not to. The tooling is mature, the debugging story is straightforward, and you can trace a request from start to finish with standard tools.

The key insight about HTTP communication is understanding when to use it and when to avoid it. It works beautifully for request-response patterns where you need immediate feedback. User authentication, data retrieval, and command operations all fit naturally into this model. Where it starts to break down is in long-running processes, fire-and-forget operations, and scenarios where you need guaranteed delivery.

Here’s what I’ve learned about making HTTP communication resilient: implement proper timeouts, circuit breakers, and retry logic from day one. Don’t wait until you’re experiencing cascading failures in production. Use libraries like Hystrix or resilience4j, or build simple exponential backoff mechanisms if you’re keeping dependencies light. The pattern that has served me well is to start with generous timeouts during development, then tighten them as you understand your service’s actual performance characteristics.

One practical tip that saved me countless hours: always include correlation IDs in your HTTP headers. When you’re debugging a issue that spans multiple services, being able to trace a single request through your entire call chain is invaluable. Make this a standard part of your HTTP communication from the beginning.

When Asynchronous Communication Makes Sense

The moment you find yourself implementing polling mechanisms or dealing with operations that naturally take time, it’s worth considering asynchronous patterns. Message queues and event-driven architectures aren’t inherently better than HTTP, but they solve different problems. I typically reach for async communication when I need to decouple services in time, handle variable processing loads, or implement reliable fire-and-forget operations.

Message queues like RabbitMQ or cloud-native solutions like AWS SQS provide guarantees that HTTP simply can’t match. When a message is queued, you know it will be processed, even if the consuming service is temporarily unavailable. This reliability comes at a cost, though: increased complexity in your deployment topology, additional infrastructure to monitor, and the need to handle message ordering and duplicate processing scenarios.

Event streaming platforms like Apache Kafka represent another evolution in async communication. They’re powerful tools for building systems where multiple services need to react to the same events, but they require significant operational expertise. I’ve seen teams struggle for months with Kafka cluster management, partition strategies, and consumer group coordination. Don’t start here unless you have the operational capacity to support it properly.

The pattern I recommend for teams new to async communication is to start with a managed message queue service. Focus on learning the programming patterns around message processing, error handling, and monitoring before you take on the operational complexity of running your own message infrastructure.

gRPC and the Performance Question

gRPC deserves special attention because it is a middle ground between the simplicity of HTTP/REST and the complexity of message-driven architectures. Built on HTTP/2 with Protocol Buffers for serialization, it offers better performance characteristics than JSON over HTTP while maintaining request-response patterns that most developers find intuitive.

The performance benefits of gRPC are real but often overstated. In most business applications, network latency and database queries dwarf the time spent on serialization. However, gRPC shines in scenarios with high call volumes between services, complex data structures, or when you need strong typing across service boundaries. The code generation from Protocol Buffer definitions eliminates an entire class of integration bugs that plague JSON-based APIs.

What I appreciate most about gRPC is how it forces you to think about your service contracts upfront. The .proto file becomes a living specification that both client and server teams can work from. This contract-first approach prevents the API evolution headaches that often emerge in REST APIs where JSON schemas drift over time without anyone noticing.

The main challenges with gRPC are tooling and debugging. While the ecosystem has matured significantly, you’ll still encounter scenarios where HTTP debugging tools don’t work well with gRPC traffic. Plan for this in your development workflow, and ensure your team has appropriate tools like grpcurl or specialized gRPC clients before you commit to this protocol.

Building Your First Communication Strategy

When you’re designing communication patterns for a new microservices system, start with a simple rule: use synchronous HTTP for operations that need immediate responses and asynchronous messaging for operations that can be processed later. This covers about 80% of use cases and gives you a foundation to build from.

Implement proper observability from the beginning. Distributed tracing tools like Jaeger or Zipkin become essential when you have multiple services communicating across different protocols. Set up structured logging with correlation IDs, implement health checks for all your services, and establish monitoring for both successful and failed communication patterns.

Consider implementing an API gateway early in your journey. While it adds another component to your system, it provides a central place to handle cross-cutting concerns like authentication, rate limiting, and request logging. This becomes particularly valuable as your service count grows and you need to manage communication policies consistently.

My recommendation for teams starting their microservices journey is to pick one primary communication pattern and master it before introducing others. Build robust error handling, monitoring, and testing practices around your chosen approach. Once those fundamentals are solid, you’ll be in a much better position to evaluate when additional communication patterns might add value to your system.

Mastering microservices communication isn’t about knowing every protocol and pattern. It’s about understanding the trade-offs deeply enough to make informed decisions for your specific context. If you’re working through similar challenges or have questions about specific communication scenarios, I’d love to hear about your experiences in the comments below.

A Gentle Introduction to Microservices Communication: Starting with What Actually Works

Why Communication Patterns Matter More Than You Think

After spending the better part of a decade untangling distributed systems that someone thought were “simple,” I’ve learned that microservices communication is where most projects either flourish or die a slow, debugging-heavy death. The choice of how your services talk to each other isn’t just a technical decision. It’s an architectural foundation that will either support your team’s growth or become the source of 3 AM wake-up calls for years to come.

When you’re starting with microservices, the sheer number of communication options can feel overwhelming. HTTP/REST, message queues, event streaming, gRPC, GraphQL federation. Each comes with its own set of trade-offs, and frankly, most tutorials skip the part where they tell you what happens when things go wrong. Let me walk you through what I wish someone had told me when I was staring at my first service-to-service communication challenge.

The truth is, there’s no perfect protocol. There are only protocols that match your current constraints and team capabilities. Start simple, learn the fundamentals, then evolve. I’ve seen too many teams jump straight to complex event-driven architectures because they read it was “best practice,” only to spend months debugging message ordering issues they didn’t know existed.

HTTP/REST: Your Reliable Starting Point

Despite what the latest conference talks might suggest, HTTP/REST is still the most practical starting point for microservices communication. It’s synchronous, debuggable, and every developer on your team already understands it. When I’m architecting a new system, I start here unless I have a compelling reason not to. The tooling is mature, the debugging story is straightforward, and you can trace a request from start to finish with standard tools.

The key insight about HTTP communication is understanding when to use it and when to avoid it. It works beautifully for request-response patterns where you need immediate feedback. User authentication, data retrieval, and command operations all fit naturally into this model. Where it starts to break down is in long-running processes, fire-and-forget operations, and scenarios where you need guaranteed delivery.

Here’s what I’ve learned about making HTTP communication resilient: implement proper timeouts, circuit breakers, and retry logic from day one. Don’t wait until you’re experiencing cascading failures in production. Use libraries like Hystrix or resilience4j, or build simple exponential backoff mechanisms if you’re keeping dependencies light. The pattern that has served me well is starting with generous timeouts during development, then tightening them as you understand your service’s actual performance characteristics.

One practical tip that saved me countless hours: always include correlation IDs in your HTTP headers. When you’re debugging an issue that spans multiple services, being able to trace a single request through your entire call chain is invaluable. Make this a standard part of your HTTP communication from the beginning.

When Asynchronous Communication Makes Sense

The moment you find yourself implementing polling mechanisms or dealing with operations that naturally take time, it’s worth considering asynchronous patterns. Message queues and event-driven architectures aren’t inherently better than HTTP, but they solve different problems. I typically reach for async communication when I need to decouple services in time, handle variable processing loads, or implement reliable fire-and-forget operations.

Message queues like RabbitMQ or cloud-native solutions like AWS SQS provide guarantees that HTTP simply can’t match. When a message is queued, you know it will be processed, even if the consuming service is temporarily unavailable. This reliability comes at a cost, though: increased complexity in your deployment topology, additional infrastructure to monitor, and the need to handle message ordering and duplicate processing scenarios.

Event streaming platforms like Apache Kafka represent another evolution in async communication. They’re powerful tools for building systems where multiple services need to react to the same events, but they require significant operational expertise. I’ve seen teams struggle for months with Kafka cluster management, partition strategies, and consumer group coordination. Don’t start here unless you have the operational capacity to support it properly.

The pattern I recommend for teams new to async communication is starting with a managed message queue service. Focus on learning the programming patterns around message processing, error handling, and monitoring before you take on the operational complexity of running your own message infrastructure.

gRPC and the Performance Question

gRPC deserves special attention because it represents a middle ground between the simplicity of HTTP/REST and the complexity of message-driven architectures. Built on HTTP/2 with Protocol Buffers for serialization, it offers better performance than JSON over HTTP while maintaining request-response patterns that most developers find intuitive.

The performance benefits of gRPC are real but often overstated. In most business applications, network latency and database queries dwarf the time spent on serialization. However, gRPC shines in scenarios with high call volumes between services, complex data structures, or when you need strong typing across service boundaries. The code generation from Protocol Buffer definitions eliminates an entire class of integration bugs that plague JSON-based APIs.

What I appreciate most about gRPC is how it forces you to think about your service contracts upfront. The .proto file becomes a living specification that both client and server teams can work from. This contract-first approach prevents the API evolution headaches that often emerge in REST APIs where JSON schemas drift over time without anyone noticing.

The main challenges with gRPC are tooling and debugging. While the ecosystem has matured significantly, you’ll still encounter scenarios where HTTP debugging tools don’t work well with gRPC traffic. Plan for this in your development workflow, and make sure your team has appropriate tools like grpcurl or specialized gRPC clients before you commit to this protocol.

Building Your First Communication Strategy

When you’re designing communication patterns for a new microservices system, start with a simple rule: use synchronous HTTP for operations that need immediate responses and asynchronous messaging for operations that can be processed later. This covers about 80% of use cases and gives you a foundation to build from.

Implement proper observability from the beginning. Distributed tracing tools like Jaeger or Zipkin become essential when you have multiple services communicating across different protocols. Set up structured logging with correlation IDs, implement health checks for all your services, and establish monitoring for both successful and failed communication patterns.

Consider implementing an API gateway early in your journey. While it adds another component to your system, it provides a central place to handle cross-cutting concerns like authentication, rate limiting, and request logging. This becomes particularly valuable as your service count grows and you need to manage communication policies consistently.

My recommendation for teams starting their microservices journey is picking one primary communication pattern and mastering it before introducing others. Build robust error handling, monitoring, and testing practices around your chosen approach. Once those fundamentals are solid, you’ll be in a much better position to evaluate when additional communication patterns might add value to your system.

The path to mastering microservices communication isn’t about knowing every protocol and pattern. It’s about understanding the trade-offs deeply enough to make informed decisions for your specific context. If you’re working through similar challenges or have questions about specific communication scenarios, I’d love to hear about your experiences in the comments below.

Why Your Microservices Will Fail Without These Three Architectural Patterns

The Monday Morning When Everything Breaks

I remember the morning when our payment service went down and took half our platform with it. We had built what we thought was a solid microservices architecture, but watching the cascade failure unfold in our monitoring dashboards taught me more about distributed systems than any textbook ever could. The issue wasn’t our code quality or our testing. It was our architecture patterns, or rather, the lack of them.

After fifteen years of building systems that need to stay up when the internet gets angry, I’ve learned that distributed systems success isn’t about picking the right database or the latest framework. It’s about implementing proven patterns that acknowledge one basic truth: in distributed systems, failure is not an edge case. It’s the primary use case you’re designing for.

Circuit Breakers: Your First Line of Defense Against Cascade Failures

The circuit breaker pattern saved us from that payment service disaster I mentioned, but only after we implemented it the hard way. When one service becomes unavailable, you need a mechanism to fail fast rather than letting timeouts cascade through your entire system. Think of it like the electrical circuit breakers in your house, but for service calls.

In practice, this means wrapping your service calls with logic that tracks failure rates and response times. When failures exceed a threshold, the circuit breaker opens, immediately returning cached responses or graceful degradation messages instead of making doomed network calls. Netflix’s Hystrix popularized this pattern, but you can implement it with libraries like resilience4j for Java or circuit breaker middleware in Go.

The key insight here isn’t just preventing cascade failures. Circuit breakers give your downstream services time to recover while maintaining user experience through fallbacks. When I implemented circuit breakers in our user profile service, our 99th percentile response times dropped from 8 seconds to 200 milliseconds during peak load because we stopped waiting for overwhelmed dependencies to time out.

Event Sourcing: When State Changes Need an Audit Trail

Event sourcing often gets dismissed as over-engineering, but I’ve seen it solve problems that traditional CRUD operations simply can’t handle. Instead of storing current state, you store the sequence of events that led to that state. This isn’t just academic computer science theory. It’s how financial systems ensure they can reconstruct account balances and how e-commerce platforms track inventory changes with perfect accuracy.

I implemented event sourcing for a trading platform where regulatory compliance required us to prove exactly how every portfolio calculation was derived. Traditional database updates would have made this impossible, but with event sourcing, we could replay any sequence of market events to reproduce the exact state at any point in time. The added benefit was that debugging became trivial because we had a complete log of what happened, when, and why.

The pattern requires careful consideration of event schema evolution and snapshot strategies for performance. You can’t just append events forever without thinking about how to query them efficiently. We learned to implement snapshots every thousand events and use projection services to maintain read-optimized views of our event streams.

Saga Pattern: Coordinating Transactions Across Service Boundaries

Distributed transactions are where many microservices architectures break down. You can’t use traditional ACID transactions across network boundaries, so you need the saga pattern to coordinate complex workflows that span multiple services. This pattern breaks long-running business processes into a series of smaller, compensatable transactions.

In our order processing system, a single customer purchase involves inventory service, payment service, shipping service, and notification service. Rather than trying to coordinate this with a distributed transaction coordinator, we implemented a choreography-based saga where each service publishes events and subscribes to the events it needs to act on. When a payment fails after inventory has been reserved, the inventory service automatically releases the hold based on the payment failure event.

The orchestration versus choreography decision is important here. Choreography works well for simple workflows but becomes harder to debug as complexity grows. For our more complex business processes, we moved to orchestration-based sagas with a central coordinator service that explicitly manages the workflow state. The trade-off is more complexity in the coordinator service but much clearer visibility into what’s happening when things go wrong.

CQRS: Separating Read and Write Responsibilities

Command Query Responsibility Segregation sounds intimidating, but it solves a real problem: optimizing for different access patterns. Your write operations have different requirements than your read operations, especially at scale. CQRS acknowledges this by using separate models and often separate datastores for commands and queries.

We implemented CQRS for our analytics dashboard where users needed complex aggregations across millions of events, but write operations were simple event insertions. The command side used a straightforward event store optimized for fast writes, while the query side used pre-computed aggregations in a columnar database optimized for analytical queries. This let us serve dashboard queries in under 100 milliseconds while handling 50,000 writes per second.

The pattern works particularly well when combined with event sourcing. Your events become the single source of truth, and you can create multiple read models optimized for different query patterns. The complexity comes in keeping read models synchronized and handling eventual consistency, but the performance and scalability benefits often justify this complexity in high-throughput systems.

Building Patterns Into Your Career

Understanding these patterns isn’t just about building better systems. It’s about developing the architectural thinking that separates senior engineers from code writers. When you can walk into a design review and explain why a circuit breaker prevents cascade failures or how event sourcing enables audit requirements, you’re demonstrating the systems thinking that leads to principal engineer and architect roles.

The best way to learn these patterns is to implement them in production systems and live with the consequences. Reading about eventual consistency is different from debugging a CQRS system where read models are lagging behind writes. Start small, pick one pattern that addresses a real pain point in your current system, and implement it thoughtfully.

Which of these patterns resonates with challenges you’re facing in your current architecture? Sometimes the pattern you think you need isn’t the one that will actually solve your problem.